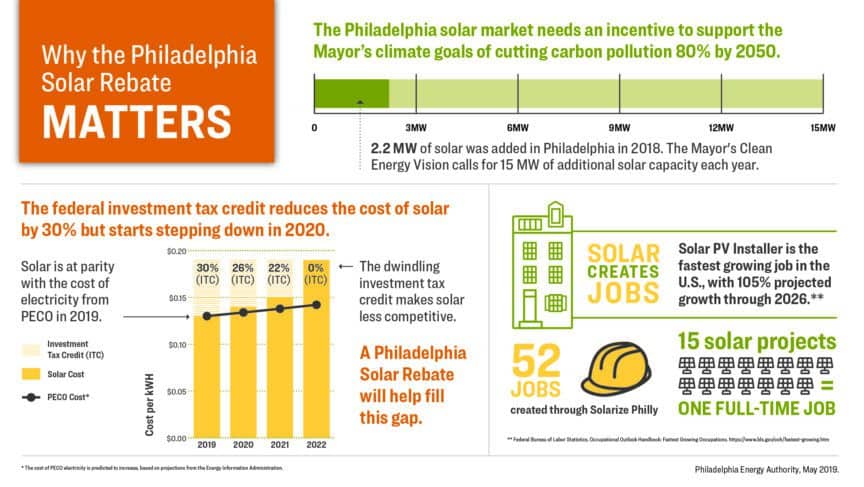
This infographic explains the benefits of the Philadelphia Solar rebate. The graphic is titled “Why the Philadelphia Solar Rebate Matters”. There are three sections.
The first section shows a bar chart, titled “The Philadelphia solar market needs an incentive to support the mayor’s climate goals of cutting carbon pollution by 80% by 2050.” The chart shows that 2.2 megawatts aka MW of solar was added in Philadelphia in 2018, and explains that the Mayor’s clean energy vision calls for 15 MW of additional solar capacity each year.
The second section is titled “The federal investment tax credit reduces the cost of solar by 30% but starts stepping down in 2020.” This illustrates the rate of Investment Tax Credit, or ITC, from 2019 to 2022. The first caption states “Solar is at a parity with the cost of electricity from PECO in 2019.” This statement refers to a 30% ITC in 2019.
There is a steady decline in ITC from 2019 to 2022, going from 30% in 2019 to 26% in 2020, to 22% in 2021, and to 0% in 2022. The associated caption reads, “The dwindling investment tax credit makes solar less competitive. A Philadelphia Solar Rebate will help fill this gap.”
The third section illustrates how many jobs have been created through Solarize Philly. The first caption reads, “Solar Creates Jobs. Solar PV installer is the fastest growing job in the U.S. with105% projected growth through 2026.” The second caption reads “52 jobs created through Solarize Philly. 15 solar projects equals one full-time job.”
